
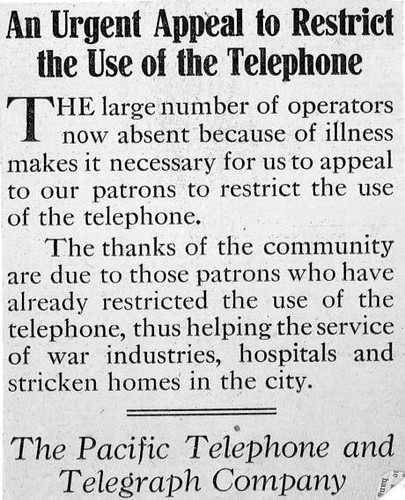
Newspaper notice asking people not to use the telephone system during the flu epidemic. Found in the 1918 Public Utilities annual report (Record Series 1802-H9), Seattle Municipal Archives.
During our daily phone conversation, my mother said she wished she had more information about the 1918 influenza pandemic and how it compares to today’s COVID-19 pandemic. Mom, this blog is for you!
From 1914 to 1918, World War I killed somewhere between 20 and 22.5 million people, nearly evenly divided between soldiers and civilians. In a single year, the influenza pandemic killed two to four times more people than the war.
The influenza pandemic began during the last year of the war and lasted until 1920. The low-end estimate of the number of people killed in the 1918 influenza pandemic is 50 million around the world, with some estimates ranging up to 100 million. The pandemic infected one person in three and killed one to two percent of the population of the entire world.
In the United States, the influenza pandemic killed 675,000 people. This influenza, sometimes called the “Spanish flu” killed about two and one-half percent of the people who got the virus, compared to about one-tenth of one percent for other varieties of the flu.
Today’s COVID-19 also has a high death rate, estimated at two to three percent of those infected with the virus. Reported death rate varies widely, from one percent in Germany to eleven percent in Italy. Many factors influence the death rate, including age of population, medical care available, accuracy of identification of infections, different methods or under-reporting of cause of death.
Every year, seasonal flu takes many lives. Over the past ten years, flu-related deaths in the United States have ranged from a low of about 12,000 in the 2011-12 flu season to a high of about 60,000 in the 2017-18 flu season. The effectiveness of each year’s vaccine and the strength of each year’s virus account for the differences. On average, about 200,000 people are hospitalized with flu-like symptoms each year in the United States.
The 1918 influenza pandemic began at the end of World War I. The first peak in the United States came in the fall of 1918, with a second peak in the February-March 1919.
From February 26 to April 9, 495,000 people tested positive for COVID-19 in the United States. Testing is unavailable for most people, so these numbers are low. Many more people are infected. More than 18,000 people in the United States have died from COVID-19 during these 43 days. Again, this number represents only those who have tested positive and then died of COVID-19: thus, the actual number of COVID-19 deaths is much higher.
We do not know when COVID-19 will peak in the United States, or whether it will come back in a second peak later on. That’s only one of many things we do not know about COVID-19, such as:
- Is someone who has recovered from the virus immune for life?
- If not, how long will immunity last?
- If someone has a mild infection or no symptoms, do they acquire immunity?
- Will the virus go away in the summer?
- Will it come back in the fall?
In Minnesota, the first report of the 1918 influenza came at the end of September in that year, and the first death was reported on October 1. The number of people infected quickly rose to a thousand. MinnPost published a great look back at the 1918 pandemic, which shows how quickly it progressed:
“The City of Minneapolis began taking steps to ban public gatherings on Oct. 11. That same day, a new U.S. Army dispatch reported that that flu deaths in the army camps were inching up toward 8,000. In Minneapolis, the epidemic was on the upswing as reports of new cases poured into the city’s health department. On Oct. 10, the agency’s head, Dr. H.M. Guilford, announced that the city’s 221 new cases represented a 50 percent increase over the previous day’s report. At General Hospital 40 nurses had been stricken, forcing hospital officials to scramble to fill the vacancies created when so many of their own staff members were too ill to work….
“There was a slight uptick in the incidence of the disease in early December, but that wave soon dissipated as well. In 1918, 125,000 cases of the flu were reported in Minnesota, causing 7,260 deaths.”
The first Minnesota COVID-19 case was reported on March 6. By April 10, 1,336 people in Minnesota had tested positive for the virus, even with testing limited mostly to people in congregate living situations and health care workers. Health officials say the actual number of Minnesotans with the virus may be 100 times that number. That’s likely also true nationwide, as the United States lags far behind other countries in testing for the virus.
On April 10, the Minnesota Department of Health (MDH) released its modeling on the COVID-19 pandemic in Minnesota.
“The Minnesota model estimates, with some uncertainty, the number of daily COVID-19 cases, how many people are in the ICU, and how many people die from COVID-19 in Minnesota. The model predicts approximately when the most people will get COVID-19 (the peak of the epidemic), how many people that will be, and when more people will need ICU care than the number of ICU beds that are available.”
The MDH page on modeling offers explanations in a variety of formats:
- Video briefing: Minnesota COVID-19 Modeling with Q+A – April 10, 2020
- Slides: SARS-CoV-2 (COVID-19) Modeling (Version 2.0) – April 10, 2020 (PDF)
- Frequently asked questions: Minnesota COVID-19 Modeling (PDF)
- Infographic: Minnesota COVID-19 Model (PDF)
- Technical documentation: Modeling the Impact of Social Distancing Measures on the Spread of SARS-CoV-2 in Minnesota (PDF)
Discover more from News Day
Subscribe to get the latest posts sent to your email.

Your research and analyses is pitch perfect. That’s why I read your “stuff.” It’s also why I listen when your soft voice speaks. Hello, Mary’s mom! Your daughter is a gem!
LikeLike
…IS pitch perfect? Only if it’s analysis, instead of analyses. Help! I’m at the mercy of my inner language harpy!
LikeLike